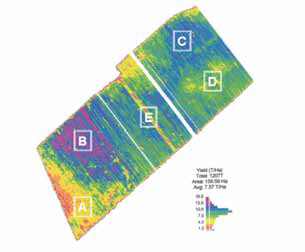
Yield monitor map illustrating yield variability.
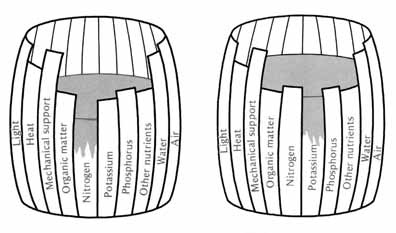
An illustration of the law of the minimum (after Brady, 1990).
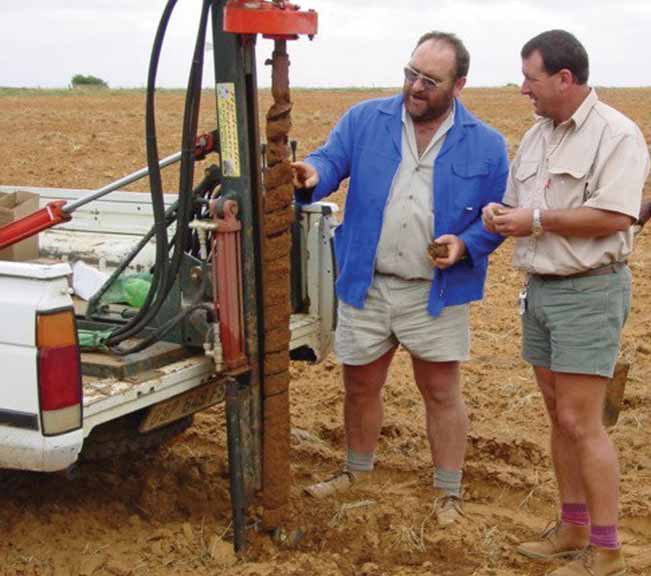
Jacques Odendaal (Senwes Soil Surveying Services, left) discussing a soil core with a client.
The first point to acknowledge is that variability across a land
does exist. Figure 1 is a yield monitor map for a land that was
regarded as a uniform unit and treated as such. It is seen that in the lower
southwestern corner (A) the yields are less than 4 t/ha, while just north of
this (indicated as B) above 10 t/ha was recorded. In the eastern section
(right hand side), areas recorded ~10 t/ha (C) and 4 t/ha to 7 t/ha (D).
These differences are significant and have important monetary implications
and thus it is important to know the causes. The linear strip of lower
yields in the middle of the land (E) is obviously due to human error;
natural influences do not have distinct transition lines, but there are
transition zones.
A second principle to acknowledge was originally stated in the 1840s and is
known as Liebig�s law of the minimum:
�The level of plant production can be no greater than that allowed by the
most limiting of the plant
growth factors�.
This principle is very effectively illustrated by using the well-known
analogy of a wooden barrel filled with a liquid (Figure 2). The level
of water in the barrel represents the level of crop production, while the
wooden slats are essential growth factors, e.g. light, heat and nutrients.
For the first barrel, nitrogen is the limiting factor. When the nitrogen
limitation is corrected (barrel on right) the level of crop production is
raised until it is controlled by the next limiting factor, in this case
potassium.
The essential growth factors include climate (light, heat units and
moisture), physical environment (soil physical properties and situation in
the landscape) and soil nutritional status (mainly nitrogen, phosphate and
soil acidity). These are the factors that must be quantified when assessing
the resource potential for grain production. If there is a physical
limitation, this limit must be identified and accepted as the ultimate
limitation since little can be done to rectify it. However, if there are
negligible physical environment limitations and the limit is of a
nutritional nature, this can be rectified by liming and appropriate
fertilization. In this case, the question is: To what extent can one go? To
treat a 3 t/ha portion the same as a 6 t/ha portion doesn�t make sense;
either inputs will be wasted on the lower production portion or the full
potential of the high portion will not be realised.
Considering the physical environmental factors individually, the following
is known:
From the above it is obvious that to evaluate a soil with respect to
yield potential, its ability to store and hold water so that it can supply
the crop during the dry periods between rains is of cardinal importance. In
previous articles published in the Senwester, the importance of soil depth
and the clay content of the soil profile have been highlighted. Simply
stated, soil depth determines how much water a profile can hold and clay
content determines how long the water is held. If this is coupled to the
relative position in the landscape (i.e. is it in a run-off position or
water catchment position?), then a very good indicator of yield potential
can be made. It is these aspects that the
Senwes Soil surveying team evaluates when they do a soil potential survey.
Finally, if it has been established that a soil has the capacity to store
adequate water, then the nutritional status must be assessed. This can only
be done through chemical analysis of soil samples that have been properly
taken. One must not disregard the practice of band placing of fertilisers.
Thus it is of the utmost importance that soil samples are correctly taken
and a composite sample correctly representing the sampling site is sent to
the laboratory.
If further information regarding soil surveying for yield potential and
nutrient status is required, contact Jacques Odendaal on 083 458 1296, Johan
Thiart on 082 375 8908, Koos van Rensburg on 083 440 1496 or Dr Neil.
Dr Neil du Sautoy is a senior soil scientist with Senwes Agricultural
Services. Contact him at (018) 464-7391 or 082 419 0949.
|
Yield monitor map illustrating yield variability. |
|
An illustration of the law of the minimum (after Brady, 1990). |
|
Jacques Odendaal (Senwes Soil Surveying Services, left) discussing a soil core with a client. |