In this article:
The space age has brought many benefits through advances in
technology. The value of information technology innovations using GPS
(global positioning system) plotting and GIS (geographic information system)
mapping of soil surveys is a prime example.
Numerous techniques have been developed to interpret data collected at
points so that a map can be produced to give an illustration of the
variability occurring in a land. This is referred to as spatial analysis.
It is difficult to identify trends across the land from a table of numbers
presenting information collected from points in a field; hence the practice
of taking the average and treating the whole field as a unit. By plotting
the data as a map, one can easily identify the variability occurring in a
land. Once good or poor zones have been identified, it is possible to adjust
management and remedial practices. Most important is the correct
identification of changes in morphology and characteristics; this is where
the correct spatial analysis method is important.
Each method of spatial analysis has strong or weak points and one must be
aware of these when selecting an analysis method. To illustrate this, four
spatial analysis methods, namely Inverse Distance Weighted (IDW), Spline,
Kriging and Thiessen polygons, have been applied and the results of these
techniques are presented in Figure 1.
In this example the data was collected on a 100 m x 100 m grid (1 ha) for a
100 ha field. The measured value for this exercise is the physical rooting
depth of the soil, referred to as effective depth (ED), recorded in cm.
Defining the spatial analysis methods:
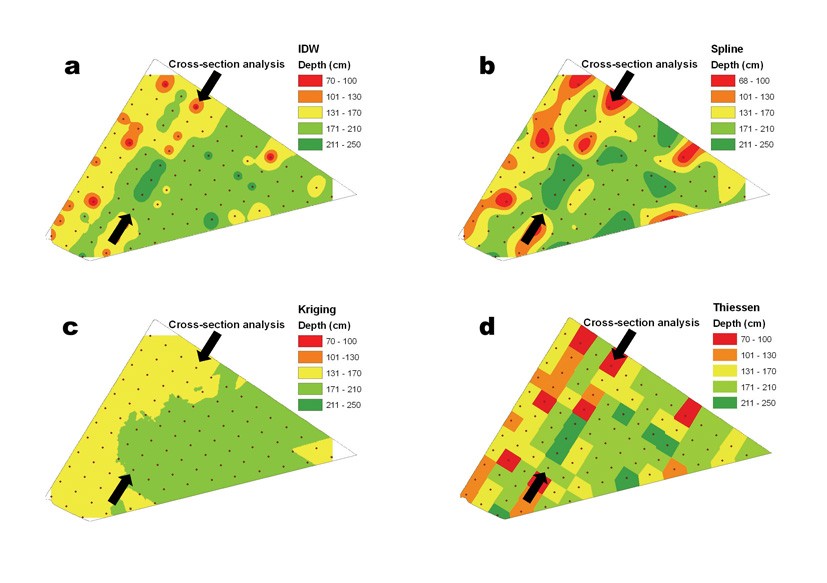
The first point to note is the differences in the images produced.
(Figure 1) Each analysis method produces different images! This raises
the question: Which is the �correct� image? To answer this, a comparison
of the actual measured values to the �method predictions� was done along
a line indicated by the arrows in Figure 1. The results of this
comparison are presented in Figure 2.
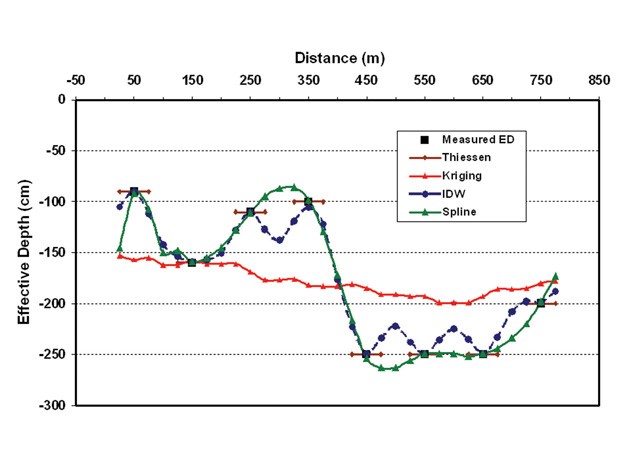
In Figure 2 it is once again seen that there are big differences in the
results from the different spatial analysis techniques. The results
obtained using the Thiessen polygon method match the actual measured
values. The IDW and Spline methods pass through the measured values for
each measurement point but show differences for the interpolated values
between measured values. The IDW method tends to produce individual
�camel humps� that gives the concentric circle image in Figure 1a. The
results achieved through Kriging show very little resemblance to the
actual measured values. Evidently the weightings from other points are
too dominant resulting in the interpolated values being severely
distorted from the actual measured values in this case.
Spatial analysis techniques affect the maps produced
Generally, because one is familiar with the idea of contour maps, we
readily accept a similar format for a soil survey. As seen above, this
approach can be very misleading. The polygon method is actually the more
correct representation of the actual field situation.
One must also remember that a soil is mainly a solid medium. Thus
diffusion, dispersion or mixing of plant nutrients or soil features
according to a gradient in relation to distance does not occur as in the
case of solutions or gases. If this was the case, one could dump
fertiliser at the gate of the land and it would move to areas of low
concentration! Thus the �smoothing� of values between points can
introduce inaccuracies. This is why the interpolated values from certain
techniques are not really a true reflection of the measured value.
New trend in Senwes farm mapping service
It is due to these features that the Senwes Agricultural Services
division has decided to use the Thiessen polygon spatial analysis method
in their farm mapping service; the emphasis being on correct
representation of field observations. The division is able to determine
the yield potential of the land, the required plant nutrient
applications and the area (ha) of each zone. For example, fertiliser
application can be calculated for each area (ha) providing for variable
application and better management of input costs.
Enquiries
If you require further information on this aspect, do not hesitate to
contact Senwes Agricultural Services for sound advice or visit our stand
in the Senwes hall at the Nampo Harvest Day. Or phone Neil du Sautoy at
(018) 464-7391 or Esmond Coen at (018) 464-7524.
Photos
Click on the photo for a higher resolution version.
|
|
Figure 1: Examples of maps produced by four different spatial analysis methods using the same data set; a) IDW, b) Spline, c) Kriging and d) Thiessen polygons. Note the two arrows indicating the locality of the cross-section analysis shown in Figure 2. |
|
|
Figure 2: Comparison of actual measured values (Blocks) to values generated by four spatial analysis methods (lines for Kriging, IDW and Spline; dumbbell for Thiessen) along a cross-section between two arrows in Figure 1. |